A Tale of two winters
Second analysis of ONS death by vaccination status August 2023
The previous post explained why the ONS population figures cannot be used. Even if there wasn’t such an extreme problem, there will still be a problem that there is no good method to accurately measure the size of the population. That makes any comparison using rates potentially flawed.
One alternative is to simply look at absolute numbers of deaths. Table 5 of the ONS dataset gives total deaths and whether or not the deaths matched vaccinated people in the NIMS dataset. Any that do not have a perfectly matching entry are classified as unvaccinated. That may exaggerate the number of unvaccinated deaths, but let’s assume that problem remains constant over time.
The simplest analysis is just to compare deaths over the course of the two Omicron winters. Let’s start by looking at non-covid deaths in the unvaccinated.
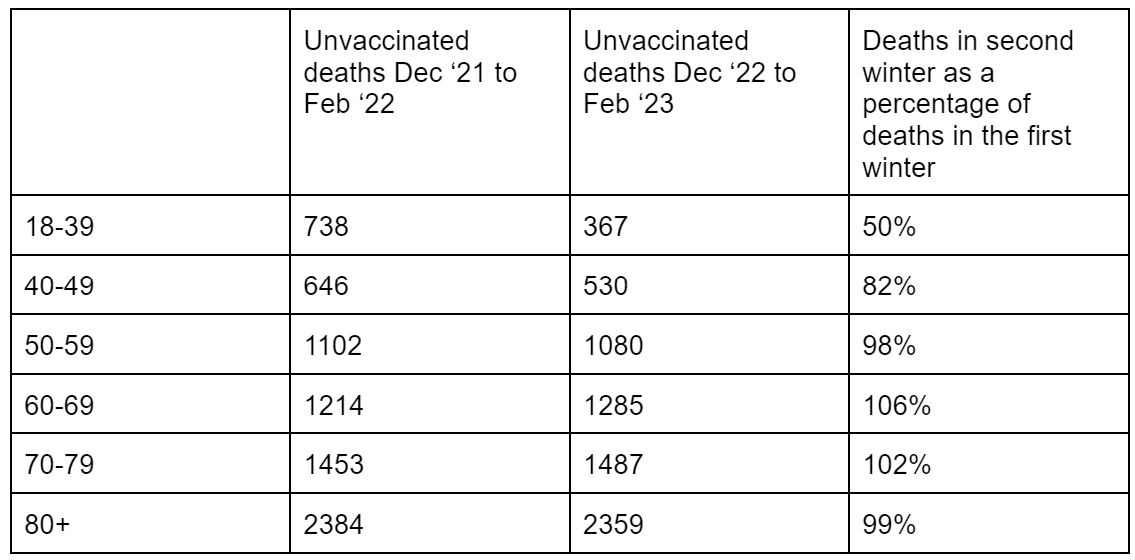
The 18-39 year old age group there were about 367 deaths of the unvaccinated from December 2022 to February 2023 which is half the 738 deaths seen the year before. Similarly for the 40-49 year old age group there were 530 deaths compared to 646 the year before. Both these age groups are more likely to have delays in death registrations due to coroner’s investigations.
For older age groups the two winters look much more similar for the unvaccinated. The final column shows the second winter as a percentage of the first. The variation for the over 50 year olds was within a few percentage points.
Table 1: Unvaccinated non-covid deaths by age group in first and second Omicron winters and showing the percentage of deaths in second winter compared to first.
The same is not true for the vaccinated. The percentage of deaths was higher for every age group compared to the unvaccinated.
Table 2: Vaccinated non-covid deaths by age group in first and second Omicron winters and showing the percentage of deaths in second winter compared to first. Final column shows unvaccinated deaths from table 1 as a comparison.
Something was killing the vaccinated at a much higher rate this winter than the previous winter and whatever it was did not affect the unvaccinated.
These vaccines were sold (and continue to be sold) as useful for saving lives and yet more lives are being lost.
Could this be a misinterpretation? The other explanation for this difference in mortality would be that the mortality in the first Omicron winter was lower for the vaccinated than it otherwise would have been, thanks to vaccination. The higher deaths in the second Omicron winter were merely a return to baseline. Let’s explore that proposal a little further.
The first point to note is that there has been no claim that the vaccines had a different efficacy at preventing death in one Omicron winter compared to another. Nor is there any plausible biological reasons why that should be the case. One difference between the winters is that the younger age groups had recent vaccination only prior to the first Omicron winter whereas the majority of people in the older age groups had recent vaccination prior to both winters. If recent vaccination were protective we should see the biggest rise in mortality among the young - but the reverse is true. It is impossible to claim more recent doses provided extra protection.
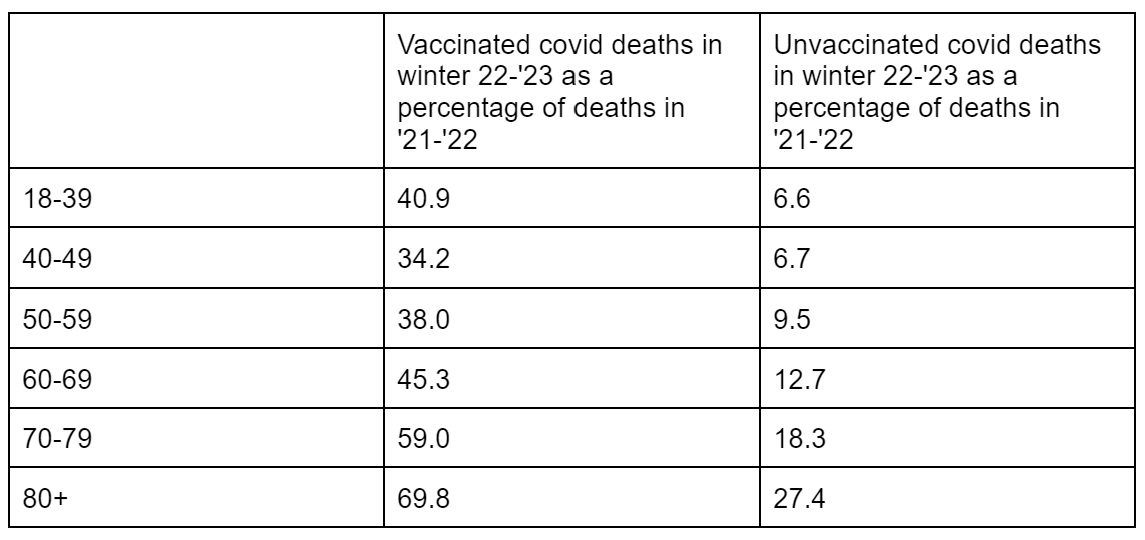
There never was a claim that vaccination was the elixir of life so how much of this was a covid issue? Table 3 compares the covid deaths in the first Omicron winter (Dec-Feb) with the second Omicron winter. The number of deaths in the second winter is presented as a fraction of those in the first winter. By any measure the second winter had fewer covid deaths, however, the unvaccinated had far fewer whereas the vaccinated still had a substantially higher proportion of deaths. The young unvaccinated fared best when comparing winters.
Table 3: Covid deaths in second Omicron winter as a percentage of covid deaths in first Omicron winter by vaccination status.
The unvaccinated can be used as a control group. By using the change in deaths among the unvaccinated between the first and second winters we can project how many vaccinated deaths there would have been had there been no (negative) effect of vaccination. For example, for 18-39 year olds there were 6.6% of the covid deaths seen in the first covid winter. Therefore the total expected deaths for the whole population would therefore be the unvaccinated deaths for that period divided by 6.6%. Subtracting the unvaccinated deaths then gives the number of expected vaccinated deaths. Using this method, for covid alone there were nearly 4,000 extra deaths among the vaccinated. For non-covid, there were nearly 20,000 extra deaths.
It is hard to know how much of the reduction was a data lag (which should apply equally to the vaccinated and the unvaccinated groups). Assuming that is minimal by now, what we see is that the unvaccinated are experiencing a period of low mortality which is what would be expected after a period of high mortality, as people who were frail and have died are no longer around to die the following winter. However, for the vaccinated the mortality continues to be high despite recent high mortality.
Table 4: By using the unvaccinated numbers as described above, it is possible to give a measure of expected deaths in the vaccinated from which an excess vaccinated mortality can be calculated for both non-covid and covid deaths. These numbers are presented next to the total deaths seen in reality.
The raw data here does show a problem with high mortality in the vaccinated cohort for both covid and non-covid conditions. There are explanations for why this has happened including issues of immune modulation such that repeated dosing has led to the type of antibody produced switching from being protective to being of a type that the body ignores as it does with pollen or food.
Any reasonable person would want to keep a very close eye on how this progresses in order to try to protect public health. However, the ONS have announced that they will no longer be reporting data on deaths by vaccination status. It is an outrageous dereliction of duty to the public.


Once it becomes impossible to reasonably claim that the experimental covid vaxxines were/are beneficial then the obvious trick is to discontinue publishing the evidence that reveals the awful truth.
The same 'remedy' was employed by the NSW authorities in Australia as soon as the rates of hospitalisation and ICU admissions were far higher for the vaccinated than for the unvaccinated. Reporting by vax status was immediately stopped.
Dr Clare has been a shining light in the darkness where others have tried to conceal the truth about covid and the human tragedy that the reckless use of these vaxxines has wrought.
Dynamite. Some extra summary stats which I think would be useful for winter 22/23.
Increase in non-COVID deaths due to vaccination: 14%
Increase in COVID deaths due to vaccination: 64%
Worst affected are the youngest ages.
Full table:
Non-COVID Excess % change COVID Excess % change
18-39 1,106 411 37% 27 23 85%
40-49 2,114 231 11% 50 40 80%
50-59 6,593 63 1% 160 120 75%
60-69 14,743 863 6% 435 313 72%
70-79 32,115 3,170 10% 1,257 867 69%
80+ 83,758 14,427 17% 4,230 2,572 61%
Total 140,429 19,165 14% 6,159 3,935 64%